
KNN stands for K-Nearest Neighbors, which is a supervised machine learning algorithm used for classification and regression tasks. KNN is called a ‘Lazy Learner’ as KNN does not build a model during the training rather it simply memorizes the entire dataset and then simply uses that to perform action on the dataset when it is required at the time of classifying the new datapoint.
 |
| Fig. KNN |
In KNN classification, when a new input data point is to be classified, the algorithm looks at the ‘k’ nearest data points (neighbors) to the new point in the feature space. Then, it assigns the class label (in classification) or predicts the value (in regression) based on the majority class or average value of these ‘k’ neighbors.
KNN is utilized in various domains of classification and regression such as recommendation systems, image recognition, financial forecasting, and medical diagnosis due to its simplicity and effectiveness in classifying or predicting based on nearest neighbors.
KNN is a simple and intuitive algorithm, also it requires only a few hyperparameters but can be computationally expensive, especially with large datasets, as it requires storing all training data points and calculating distances between the new point and all training points during prediction. The performance of the KNN algorithm is impacted by the curse of dimensionality, meaning that it struggles to effectively classify data points when the number of dimensions is high and hence is prone to overfitting.
Distance Metrics
Like KNN is k-nearest neighbor, so to determine which point is neares we need distance metrics to group the data points based on distance. The various distance metrics and there formulas are as follows:
1. Euclidean Distance
This is the most common technique to measure distance between any two points in a plane. It finds the distance between two real-valued vectors as shown below.
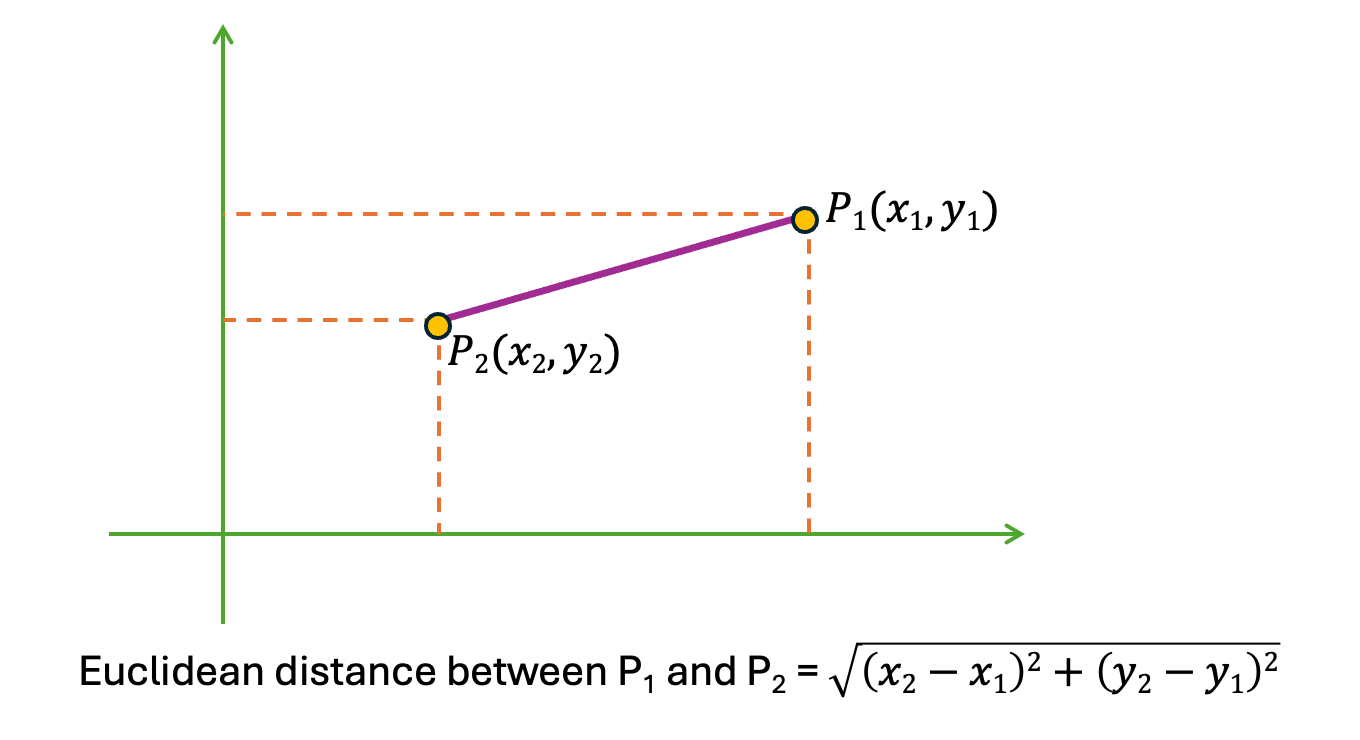 |
| Fig. Euclidean distance |
2. Manhattan Distance
This is also known as taxicab distance or city block distance. The distance between two points is the sum of the absolute differences of their Cartesian coordinates. Generally, the Manhattan distance formula for the previous diagram(Euclidean distance) would be, |x2-x1|+|y2-y1|. A representation of manhattan distance is given below.
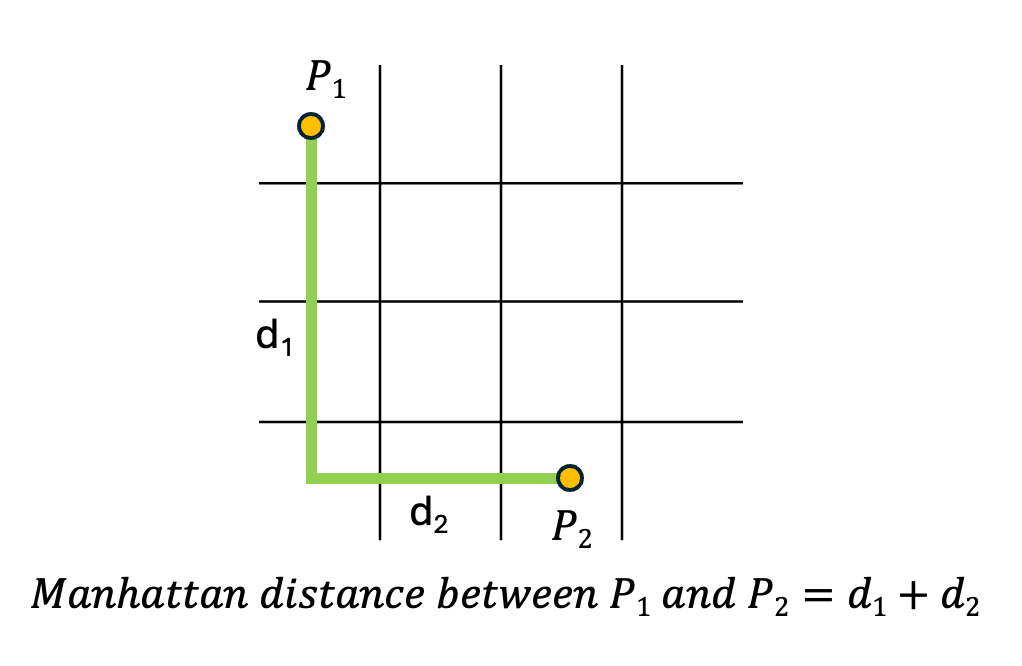 |
| Fig. Manhattan Distance |
3. Minkowski Distance
It is a metric intended for real-valued vector spaces. We can calculate Minkowski distance only in a normed vector space, which means in a space where distances can be represented as a vector that has a length and the lengths cannot be negative.
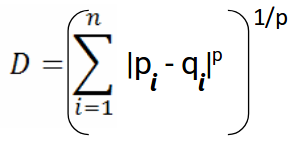 |
| Fig. Minkowski Distance [Image Source] |
This above formula for Minkowski distance is in generalized form and we can manipulate it to get different distance metrices. The p value in the formula can be manipulated to give us different distances like:
- p = 1, when p is set to 1 we get Manhattan distance
- p = 2, when p is set to 2 we get Euclidean distance
Choosing a K value
The choice of ‘k’ is a hyperparameter that needs to be tuned during the model training process. If your input data has more outliers/ noise a higher value of ‘k’ is prefered. Generally, larger values of ‘k’ result in smoother decision boundaries, while smaller values of ‘k’ may lead to more complex decision boundaries that can better fit the training data but may also be more prone to overfitting. Generally an odd value of ‘k’ is selected to prevent ties in classification. Cross validation methods are used to select the best value of ‘k’.
Working of KNN
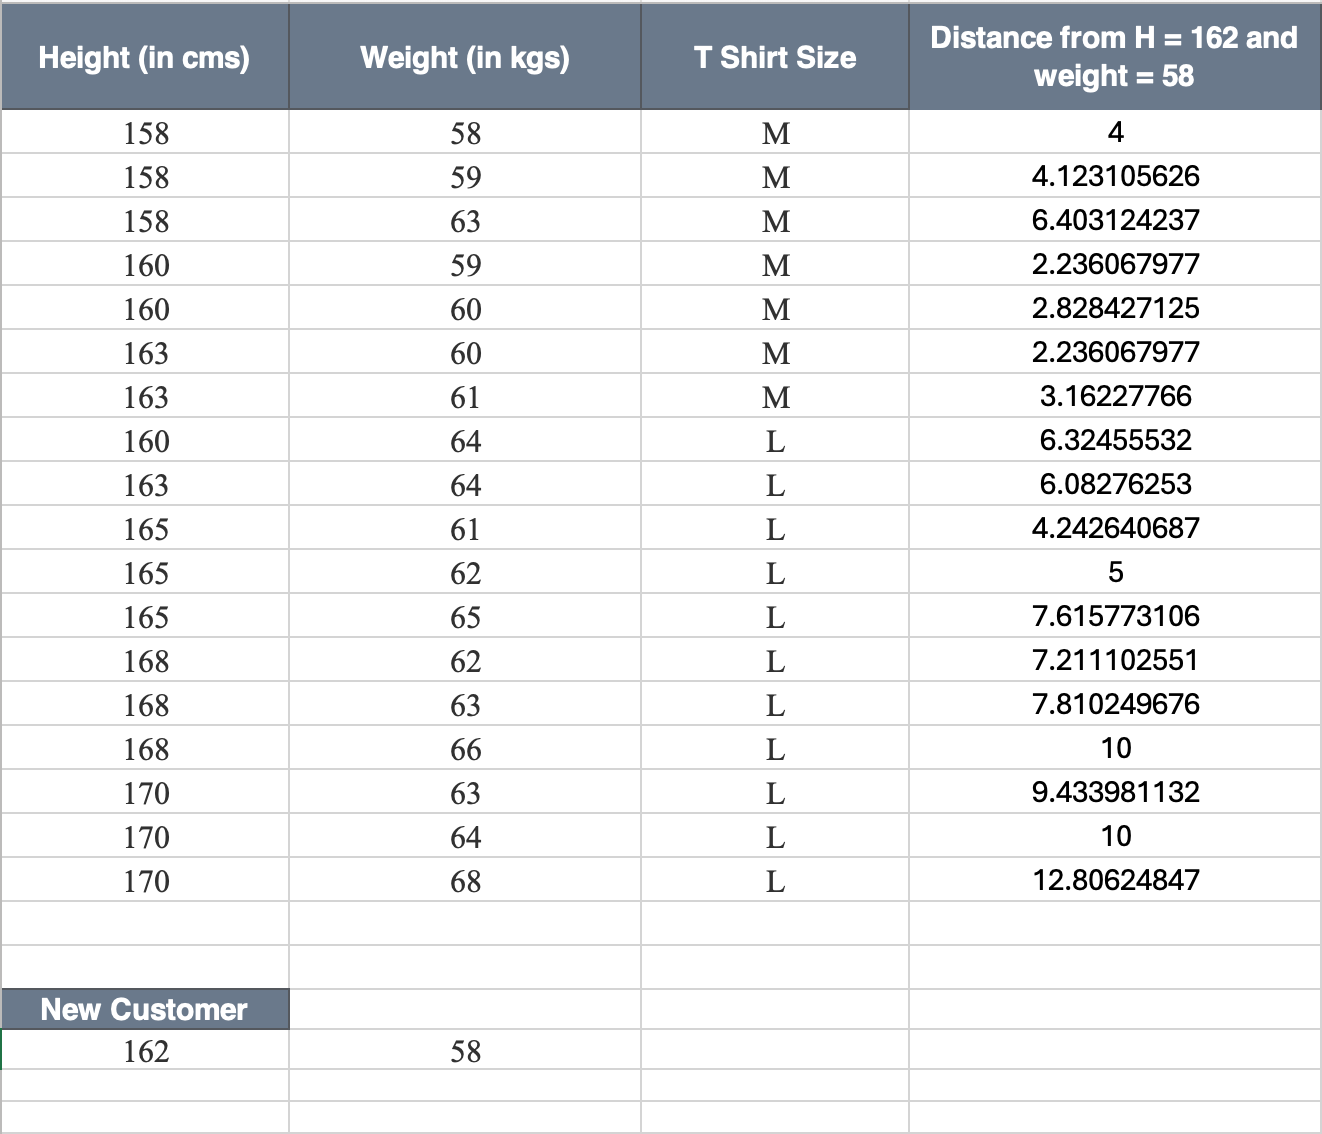
So, let us take an example of classification and see how KNN works on it. Suppose we have height, weight and T-shirt size of some customers and we need to predict the T-shirt size of a new customer given only height and weight information we have. Data including height, weight and T-shirt size information is shown in the image below.
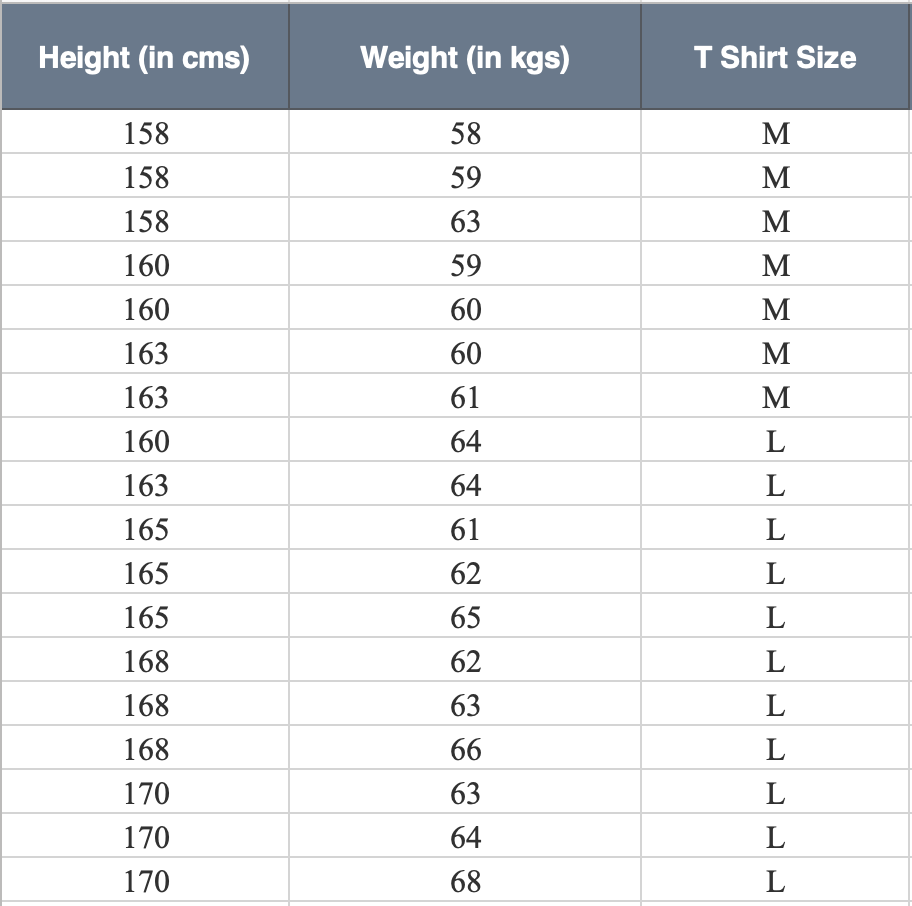 |
| Fig. Example Dataset — KNN |
Now lets us take the K value to be 5 and we will use euclidean ditance here. So, we have a new customer that walks in and we know his height and weight and we need to find the shirt size for this person. So, his Height = 162 and Weight = 58.
The first step here now would be to calculate the distance between our new customer and the old ones. So, we will take each point in our data as first point and our new customer as the second point and calculate the euclidean distance between them. The same is represented in the image below.
 |
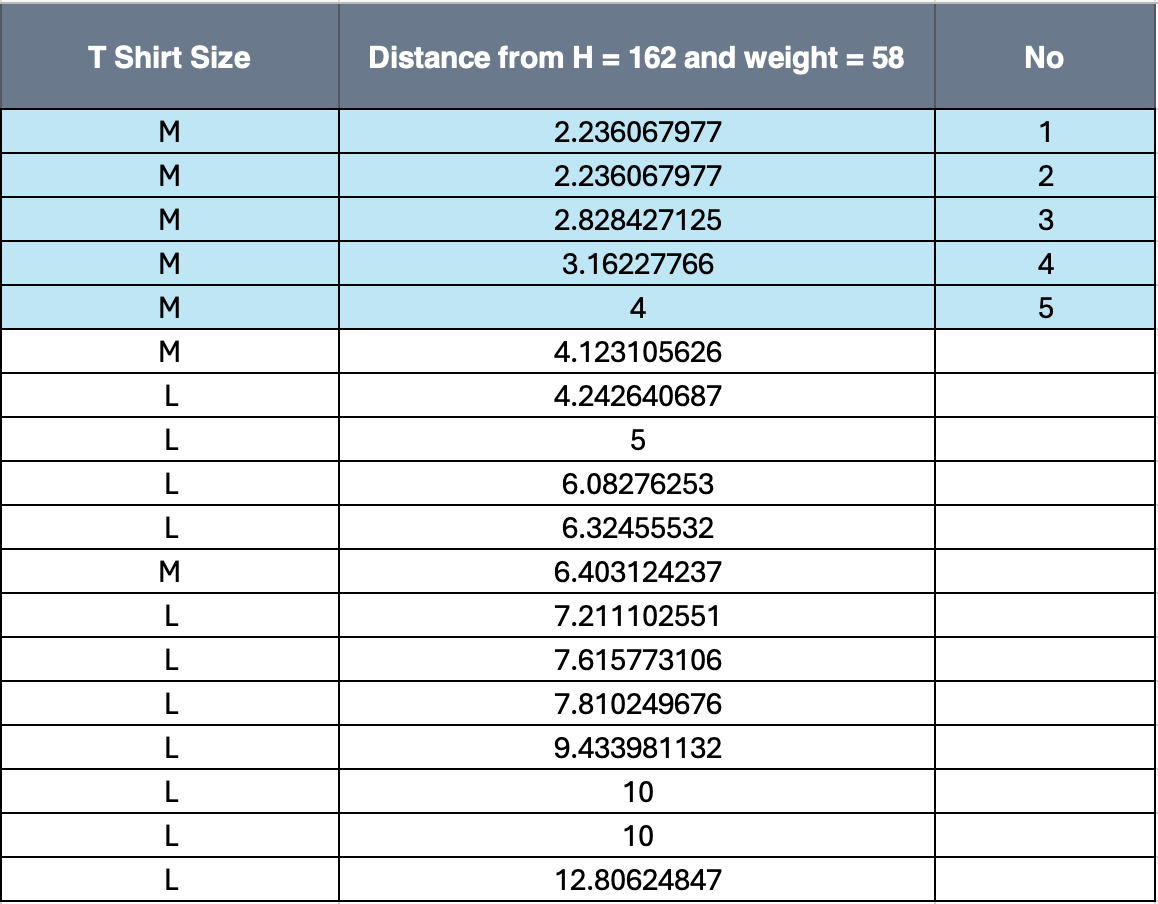
As, you can see the all these have the class as M, but if there had been a mix of values the modal class would be selected from the 5. Hence, The shirt size predicted is M for the new customer.
References
- https://scikit-learn.org/stable/modules/neighbors.html
- https://www.geeksforgeeks.org/k-nearest-neighbours/
- https://scikit learn.org/stable/modules/generated/sklearn.neighbors.KNeighborsClassifier.html
- https://www.listendata.com/2017/12/k-nearest-neighbor-step-by-step-tutorial.html
- https://en.wikipedia.org/wiki/K-nearest_neighbors_algorithm
- https://www.analyticsvidhya.com/blog/2018/03/introduction-k-neighbours-algorithm-clustering/
- https://www.kdnuggets.com/2020/11/most-popular-distance-metrics-knn.html
- https://www.w3schools.com/python/python_ml_knn.asp
Good info
ReplyDelete