
 |
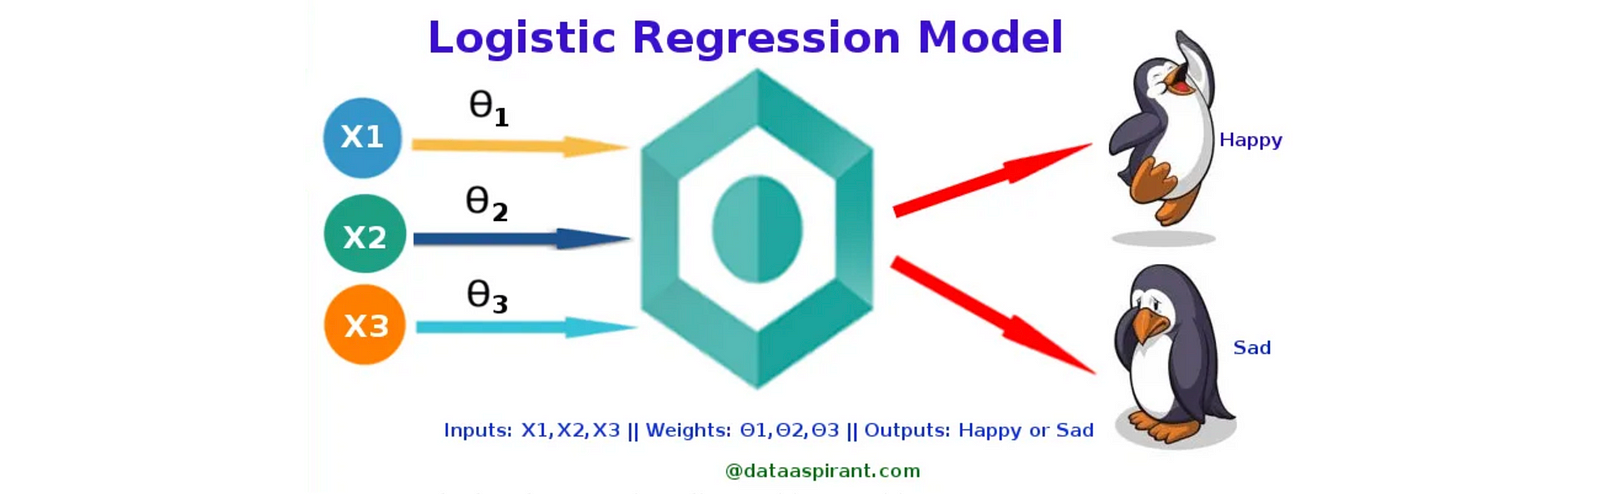
| Fig. Logistic Regression [Source] |
Lets consider an example, Predicting whether a given tumor is malignant or not can be solved using this logistic regression algorithm (This is an example for binomial logistic regression). Further, lets say that malignant is 1 and not malignant is 0 and suppose we have a prediction outcome as 0.3 then the tumor is not malignant considering our threshold value was 0.5.
The classification is mostly between only two classes, i.e. binary classification. However there is multinomial logistic regression also that can be used instead of binomial logistic regression. There are 3 types of logistic regression: Binomial logistic regression, Multinomial logistic regression and Ordinal logistic regression.
Binomial logistic regression uses a sigmoid function, this function takes input (called the independent variable) and the output (called the dependent variable) produced is always between 0 and 1. So, if we have 2 classes and the output is less than 0.5 then it belongs to class 0 and is more than 0.5 then to class 1.
The sigmoid function is a “S” shaped logistic function, all it does is take any real valued number and maps it to another number between 0 and 1. It has a “S” shaped curve like shown in the image below. You can read more about sigmoid function here.
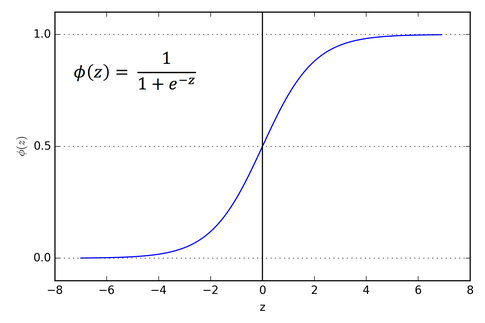 |
| Fig. Sigmoid Function [Source] |
In case of a multinomial logistic regression, there can be 3 or more classes that are unordered dependent variables, the softmax function is used. The softmax function (also known as softargmax or normalized exponential function) converts a vector of K real numbers into a probability distribution of K possible outcomes. Softmax function output values are always in the range of (0, 1). The sum of the output values will always equal to the 1. It is a generalization of the logistic function to multiple dimensions making it possible to have 3 or more classes. Examples of multinomial can be predicting which stream a student a student is likely to choose for his higher studies given a certain factors that may affect his decision.
The ordinal logistic regression has 3 or more classes that are ordered dependent variable. Examples of ordinal logistic regression include severity of a disease or even simpler like predicting the size of coke people are likely to buy at a given food chain given a certain factors that may influence their decisions. So, the target in case of this ordinal logistic regression is always ordered like here it may be small, medium, large and extra large.
We know now that logistic regression is used when we have the dependent value as binary unlike linear regression which has continuous values for the dependent variable. So, how does logistic regression work ? (NOTE, here we will only be disussing the binomial logistic regression in this blog!) So, very firstly you need to have data in a format of rows and columns and the target should be binary. The logistic regression assumes that each of the observations, basically rows in your dataset are all independent of one another and not a repetition. For the best results, there should be no outliers in your data so, preprocess your data well. Next is training the model, this is essentially finding the best values of the model parameters that minimizes error in training data. Next, evaluate the model and then finally use it to make predictions.
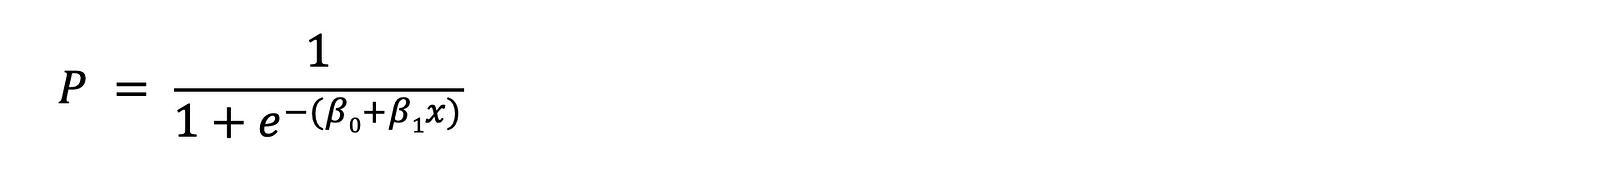
Now lets look at all equations used in logistic regression and what do they mean, the sigmoid function or the logistic function has the formula as given below,
So lets find out how it is this formula given above, we now that linear regression is basically finding the best fit line and that best fit line has the equation as follows:
y = β1*x + βo
And y here is our predicted value, now in case of our logistic regression we are predicting the probability(P).
p = β1*x + βo
As this is a probability we have to make sure that the value of this P is between 0 and 1. So we take odds of this. What is odds? Odds are nothing but the ratio of the probability of success and probability of failure. The probability of success is p then the probability of failure is 1-p. Then our formula becomes like as given below,

But odds are always positive but we don’t want a restricted range as a restricted range would mean that the number of datapoints would reduce that will reduce the correlation so we take log of it so that makes it as,

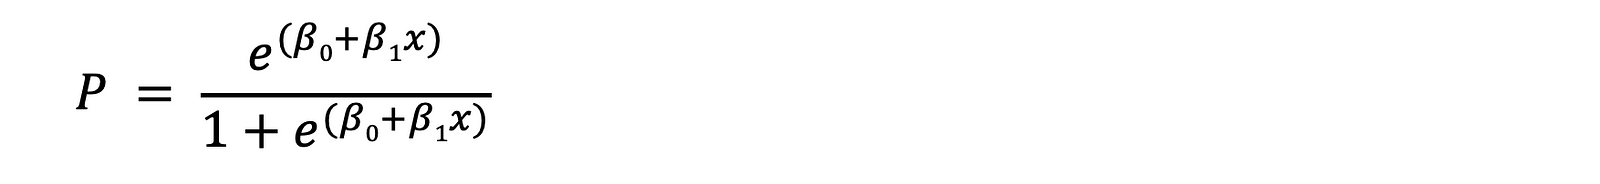
Now since we want the final result to be a probability, so we take an exponential on both sides which gives us this,

Simplifying this further you will get the sigmoid or logistic function as this given below,
Here as you can see, x is the input variable that is then combined linearly with coefficient (βo, β1) values to predict an output value that is between 0 and 1 i.e. P.
Here βo is the bias or the intercept term and the β1 is the is the coefficient for the single input value i.e. x. Both these values are real valued constants that needs to be learned during the training phase with the training data.
Lets look at how logistic regression works, the algorithm—
- Start with an initial guess for the coefficients.
- Use the logistic function to calculate the predicted probabilities for each observation.
- Calculate the likelihood function, measuring how well the model fits the data.
- Use an optimization technique, such as Adaptive Moment Estimation (ADAM) to find the coefficients that maximize the likelihood function.
For example, lets say we need to find out the gender based on height. So we have only binary output, 2 classes male and female. Logistic regression predicts probabilities which means we are modeling the probability that an input (X) belongs to the default class (Y=1). So if you see we are not just classifying but also estimating the probabilities.
Logistic regression is a powerful classification technique by estimating the likelihood of an input belonging to a particular class. This estimation is inherently a probability prediction, which must be converted into binary values (0 or 1) to make class predictions.
Maximum likelihood estimation, a common algorithm is used to estimate the coefficients βo and β1. But now, the best coefficients would result in a model that would predict a value very close to 1 (e.g. male) for the default class and a value very close to 0 (e.g. female) for the other class and hence in practice the optimization of logistic regression models is often implemented using efficient numerical optimization algorithms such as Adaptive Moment Estimation (ADAM). These methods provide faster convergence and improved efficiency, particularly when dealing with large datasets.
Now the data is trained and we know the coefficients, So lets say that we have found the coeficients to be βo = -100 and β1 = 0.6, to make a prediction all you have to do is put in the values and calculate. Lets say we are calculating for height = 150 cm, whether male or female. so are x = 150 in our formula. So basically what we are calculating is,
P(male|height=150)
This means that the probability of being a male given the height is 150 cm. So after calculating you will get the below as answer
P = exp(βo+ β1*X) / (1 + exp(βo+ β1*X))
P = exp(-100 + 0.6*150) / (1 + exp(-100 + 0.6*150))
P = 0.0000453978687
Here the P(male|height=150) = 0.0000453978687 which is lower than 0.5 that means its not male but female. So if the output for any of the new datapoint you take is lower than 0.5 then female otherwise if greater than 0.5 then male. So, the prediction for this case is Female!
References
- https://www.geeksforgeeks.org/understanding-logistic-regression/
- https://www.analyticsvidhya.com/blog/2021/08/conceptual-understanding-of-logistic-regression-for-data-science-beginners/
- https://dataaspirant.com/how-logistic-regression-model-works/
- https://machinelearningmastery.com/logistic-regression-for-machine-learning/
- https://towardsdatascience.com/logistic-regression-detailed-overview-46c4da4303bc